Why do we need Google Analytics 4?
There’s a lot of negativity online about GA4. People are finding it confusing, even frustrating. You might be wondering why Universal Analytics has to go away.
Can’t things stay just as they are!?
The reality is that the internet has changed a lot since Universal Analytics was launched over a decade ago.
The problems with Universal Analytics are becoming more and more apparent as time goes on.
The problems with Universal Analytics
1. It’s very very slow
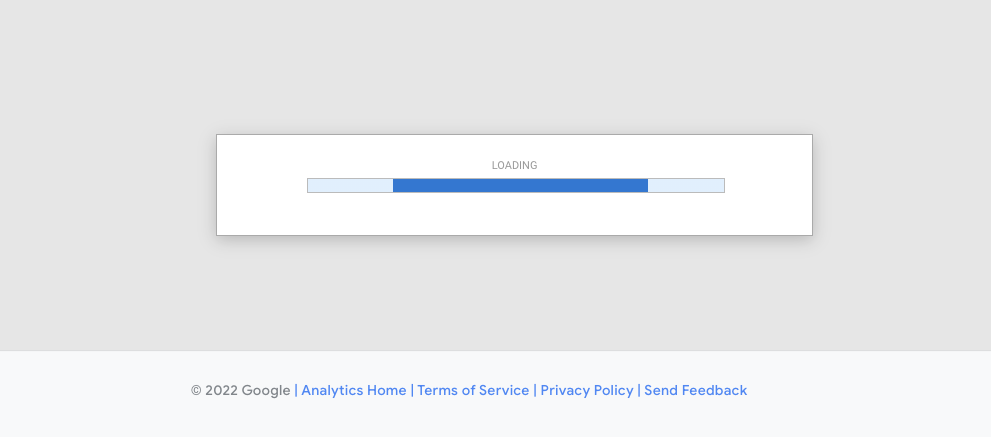
UA reports take 30 seconds plus to load. I open dozens of reports a day which is a lot of sitting and waiting.
I’ll be happy to never see this screen again:
2. The way it measures engagement is terrible
UA used a very crude way to measure user engagement: the time difference between when tracking hits like pageviews and events were sent to the GA servers.
Some examples:
- A user comes to your site and has 2 pageviews. The ‘avg time on page’ for the first page was the time difference between when the 2 pageviews happened — not terrible. The ‘avg time on page’ for the second page is 0, there’s no tracking hit after it — not great.
- A user might come from Google, spend 15 minutes reading your blog post, bookmark the page to come back to it, and leave the site. A useful visit but still marked as a bounce in UA as there’s only one pageview tracking hit.
3. Its data model is unnecessarily complex
There are 6 tracking hit types in UA. Pageviews, Events, Ecommerce, Social interactions, User timing, Exceptions (…who ever used these last ones? )
Events have a Category, Action, Label, and Value. There are 4 types of custom dimensions. I could go on, but you get the picture.
4. There are privacy issues
UA has issues in terms of privacy laws like GDPR and CCPA.
5. There are too many reports
There are close to 80 reports, dozens of which most users never open. Each report also has multiple tabs most of which repeat data. It all adds to that feeling of complexity.
GA4 solves these problems
1. GA4 is quick!
You open a report and it just instantly loads. This is a huge and under-appreciated benefit of GA4.
2. It deals with engagement in a much better way.
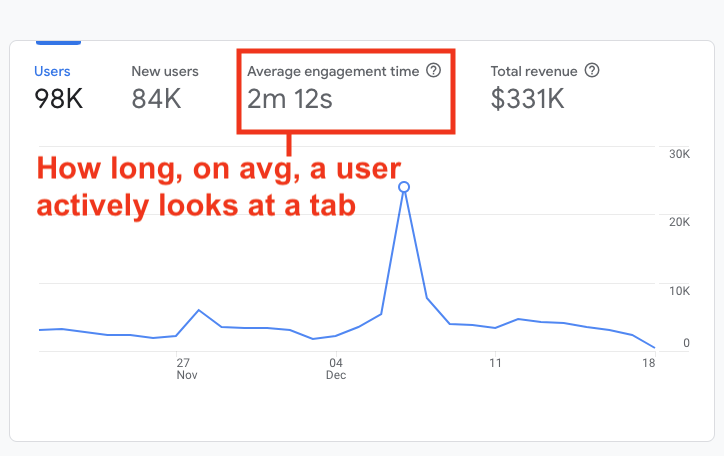
It measures how long a user actively looks at a tab (or an app). It’s a simple change but it’s a much more effective way to measure how people actually engage with your website.
3. GA4 has a simpler data model
In GA4 there’s one tracking hit type: an event. Events have optional parameters. There are 2 types of custom dimensions. It’s simpler for developers to implement and for everyone to understand compared to UA.
4. GA4 is better for privacy
It’s still not perfect but it does have some privacy forward features like IP address anonymization.
5. There are far fewer reports
The number of reports goes from about 80 in UA all the way down to around 20 in GA4. The GA team has prioritized the most important reports but there are lots of options for creating your own reports too.
Summary: GA4 is set up to be the better option for the future
GA4 isn’t perfect. It can still be confusing and frustrating to use. But Universal Analytics had plenty of issues of its own.
It’s clear to me that GA4 is a better fit for the internet we have now. The team is also working to close a lot of the gaps between GA4 and Universal Analytics.
GA4 key concepts
1. Everything is an event
Unlike previous GA versions, there’s only one type of data you can send to GA4: an event.
Add the GA4 tag to your site and it will start sending events like:
- page_view - to record pageviews
- session_start - to record when a session starts
- user_engagement - gets sent when a users session meets the criteria for being engaged
E-commerce data is sent as an event. Any custom data is sent as…. an event. It’s simple, all GA4 data is sent as an event!
You can add more data to events using custom parameters. For example, the ecommerce event ‘purchase’ has custom parameters like ‘value’, ‘tax’, and ‘currency’.
2. Goals have to be events too
I generally like the idea of having everything be an event in GA4. It’s a simple data model to understand.
It does get a little annoying when it comes to goals. Unlike in Universal Analytics, you can’t specify a URL as a goal.
You have to send an event when a user hits the page and then mark that event as a goal.
For example, if you want to record a goal when a user hits the /form-complete page, you’ll need to send a generate_lead event first.
3. You can automatically track events
By toggling on a button you can automatically measure events in Google Analytics 4 (GA4). In previous versions of GA setting these events up would have required adding code to your site or some setup in Google Tag Manager.
Now you just need to toggle a button in your data stream settings:

Here are some examples:
- Scroll tracking: This event is triggered when a user scrolls through a page on your website or app.
- Video engagement: This event is triggered when a user interacts with a video on your website or app, such as playing, pausing, or seeking.
- Site search: This event is triggered when a user performs a search on your website or app.
- File downloads: This event is triggered when a user downloads a file from your website or app.
- Outbound link: This event is triggered when a user clicks on a link that takes them to a different website or domain.
4. Engagement is different
It wasn’t always obvious but Universal Analytics gave a very poor picture of how users engaged with your website.
It used a very crude way to measure user engagement: the time difference between when tracking hits were sent to the GA servers.
This made metrics like ‘avg. time on page’, ‘bounce rate’, and ‘session duration’ misleading and bordering on useless.
A user might come from Google, spend 15 minutes reading your blog post, bookmark the page to come back to it and leave the site.
That’s a pretty useful visit in my opinion, but it gets marked as a bounce. Why? Because there’s only one tracking hit sent to Google.
GA4 deals with engagement in a much better way.
It measures how long a user actively looks at a tab (or an app). It’s a simple change but it’s a much more effective way to measure how people actually engage with your website.
GA4 removes metrics like ‘avg time on page’ and replaces them with updated engagement metrics.
Let’s run through some of these new metrics:
Avg engagement time and Avg engagement time per session: these metrics are both similar. They measure how long, on average, the browser tab was active. The difference is that ‘Avg engagement time’ is per user and ‘Avg engagement time per session’ is obviously per session.
Engaged sessions per user: For a session to be classed as ‘engaged’ one of three things needs to happen. i) the user stays on the site for more than 10 seconds, ii) the user sees 2 or more pages, or iii) the user completes a conversion.
Bounce rate (new and improved): Any session that isn’t classed as ‘engaged’ is a bounce. So the % of sessions with a bounce plus the % of engaged sessions should total 100%. Bounce rate takes a bit of a back seat in GA4, it’s not available by default but you can customize reports to see it.
5. There are fewer reports
One thing a lot of people miss at first glance is that each report in GA4 is equivalent to 8 - 9 reports in UA.
It seems hard to believe that GA4 could have most of the data you had in Universal Analytics. The number of reports has dropped from ~80 to ~20.
But now I can see the problem was that Universal Analytics had far too many reports. Lots of them were identical, just with different primary dimensions.
For example, Universal Analytics had 13 Tech and Demographics reports, GA4 has 4. It provides the same data by using the primary dimension drop-down.
How to access more reports with the primary dimension drop-down
You can use the primary dimension drop-down to swap dimensions in GA4 reports.
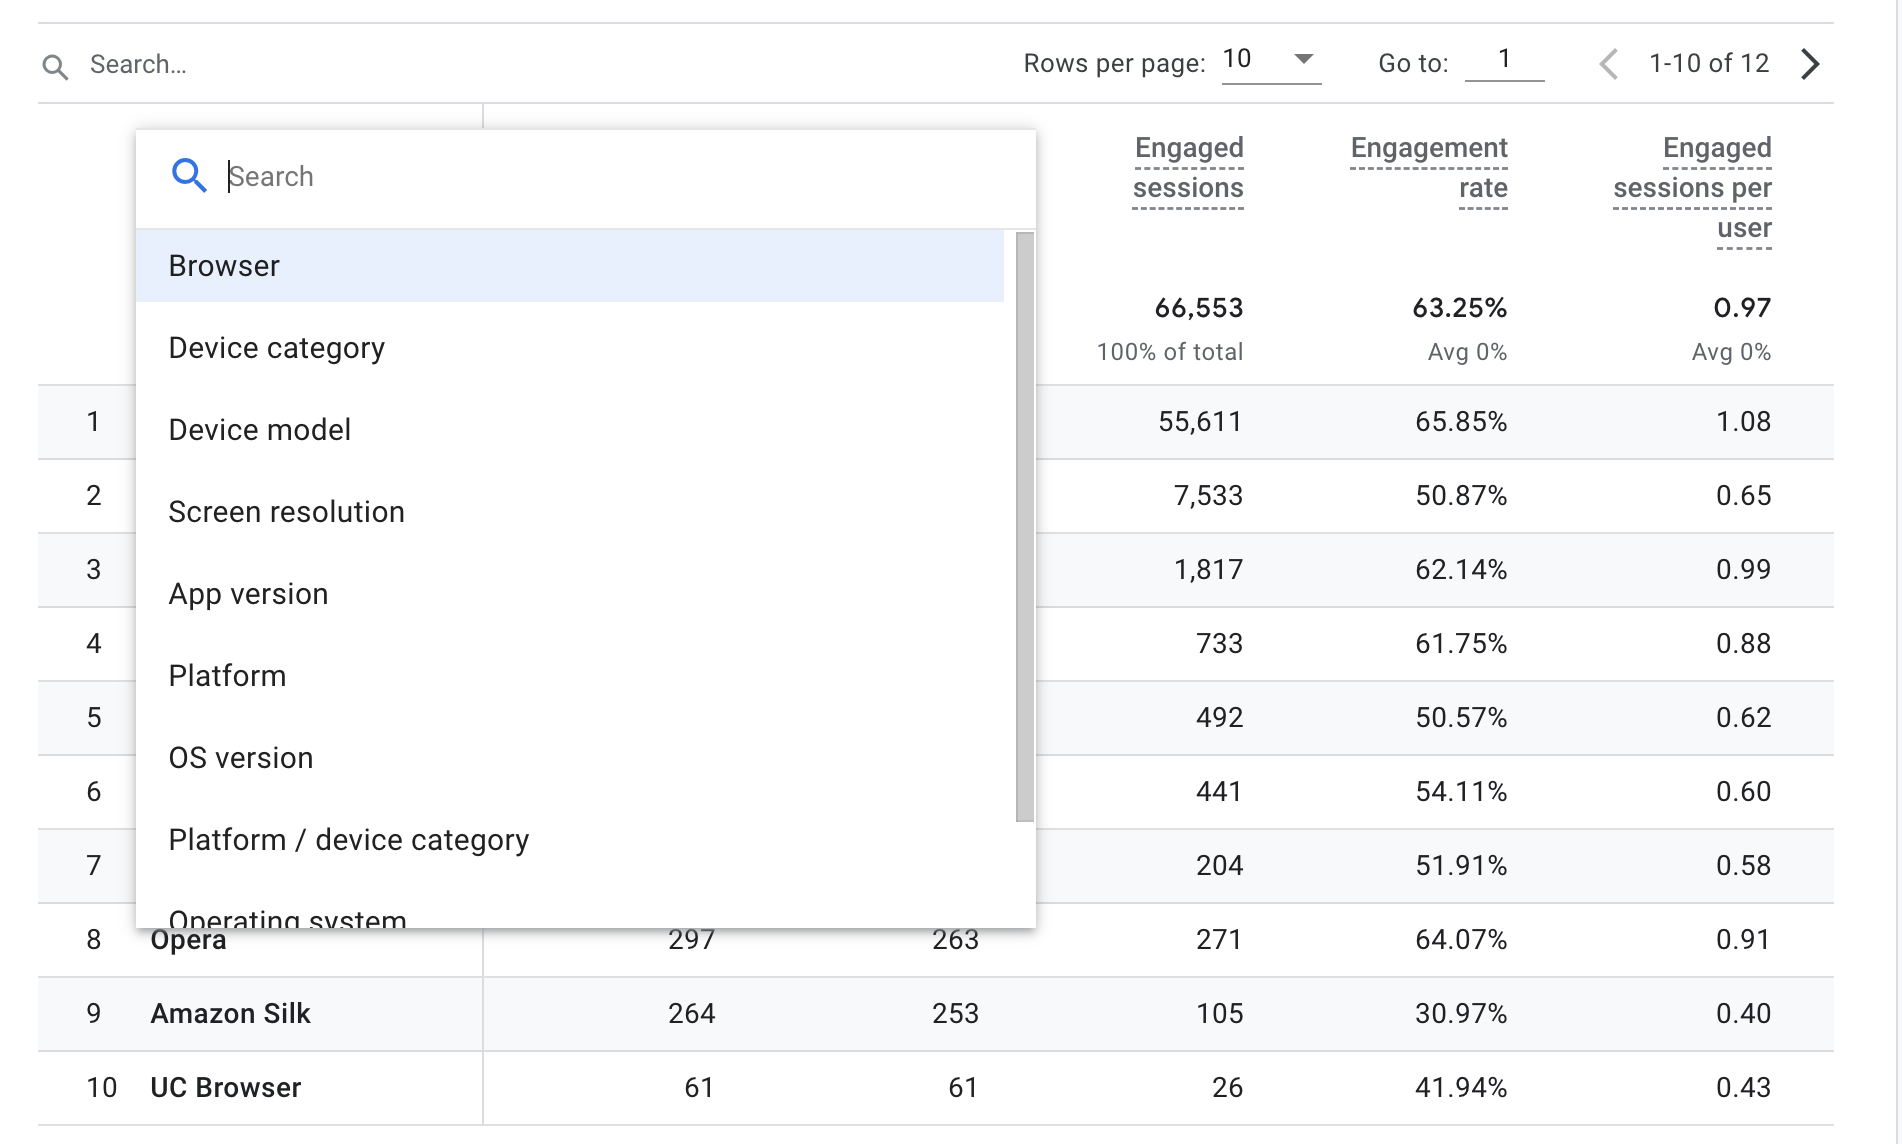
It’s 9 reports in 1.
The primary dimension switcher is just above the table on the left-hand side.
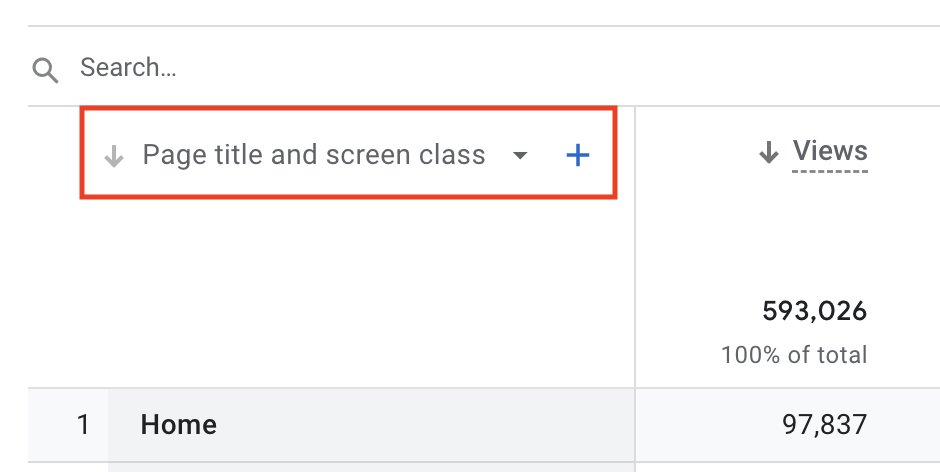
You’ll find most reports in GA4 have 5-10 more primary dimensions stored inside them like this.
6. There’s a bigger focus on custom reports
Although a lot of the data in GA4 is hiding under the sparse UI there are still lots of times when you will need to build custom reports. The custom reporting is really strong in GA4. Here are 3 ways to do it:
- Customize an existing report
- Create a new custom report using the Exploration reports
- Build a report in Looker Studio
GA4 UI tour
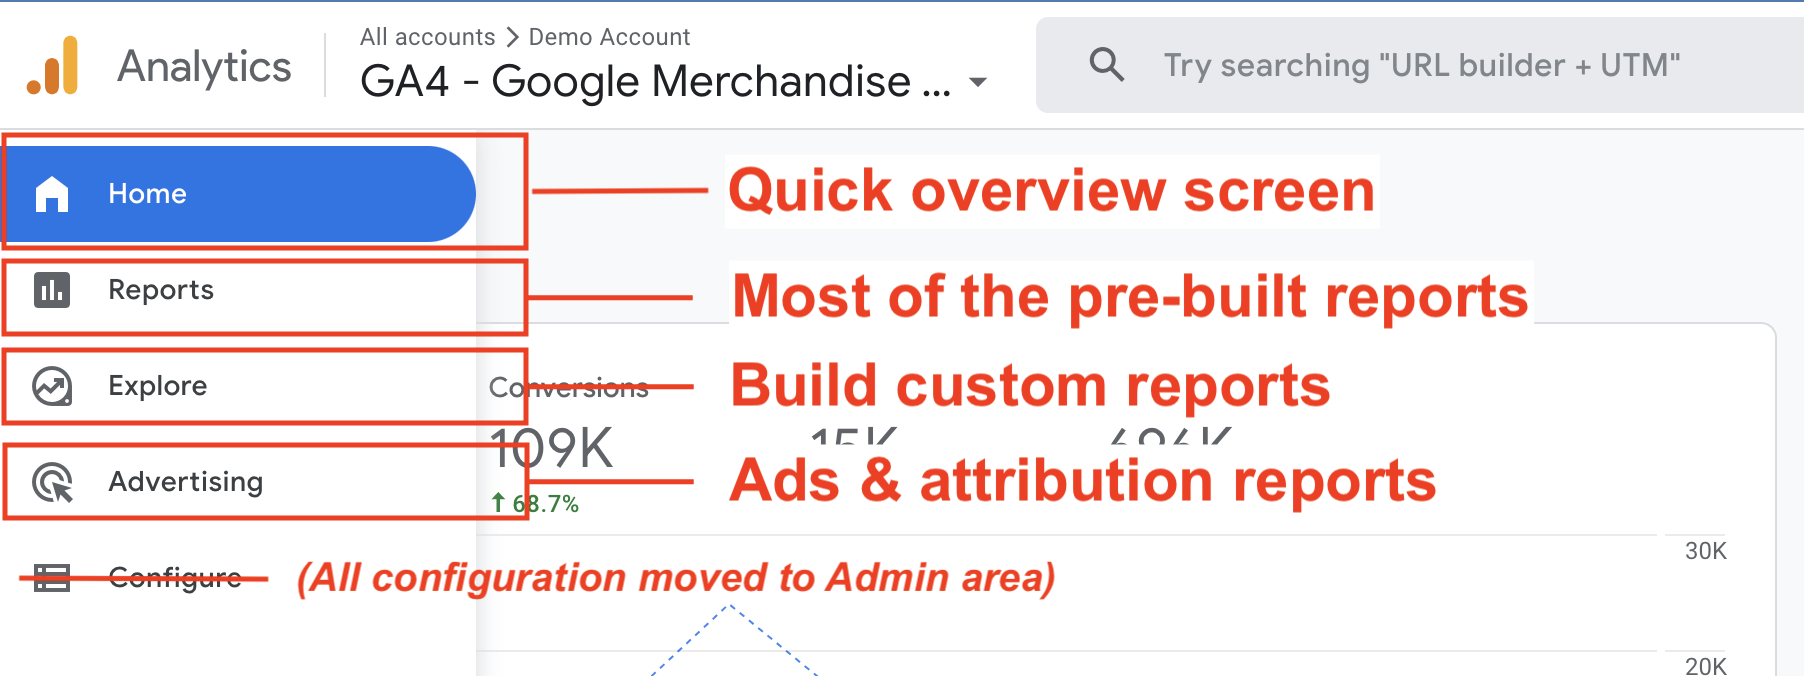
At a high level, the UI is broken up into:
- An overview section
- A main reporting section
- A section for building your custom reports from scratch
- Reports for Google Ads
Finally, there’s an admin section you can access by hitting the wheel in the bottom left of the account.
The main Reports section
GA4 has 3 blocks inside the Reports section:
- The Reports snapshot and Realtime report
- The Life cycle reports
- The User reports
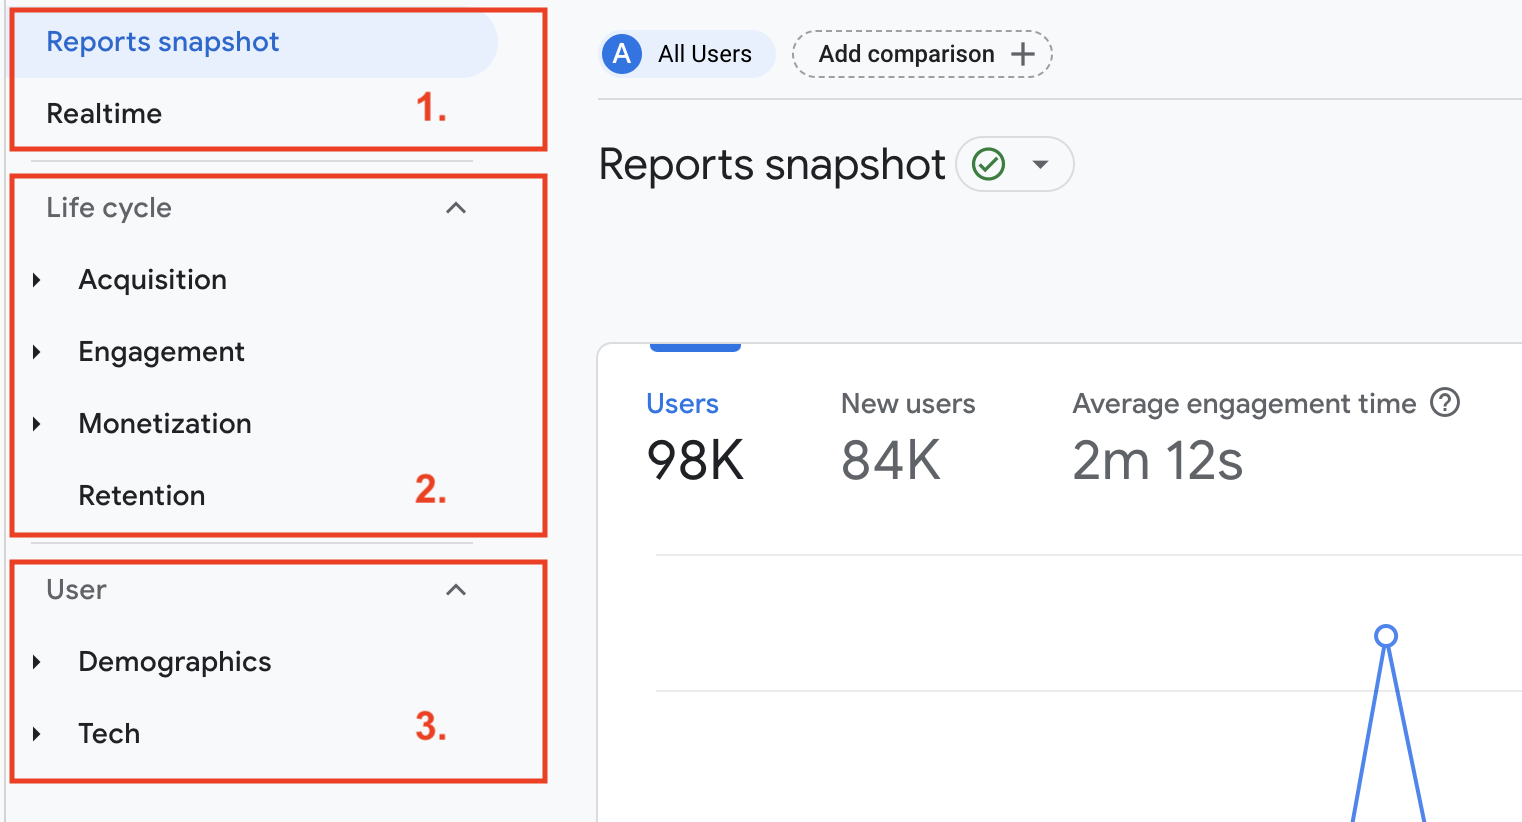
The Reports snapshot and Realtime report
This section is the most similar to Universal Analytics.
The report snapshot has an overview of key metrics including new engagement metrics.
Below, the Realtime report shows what users are doing on your site now. 6 reports in UA have been replaced by 1 here by using cards showing data like the number of users, devices, sources, events, conversions, and pages.
Life cycle reports
The bulk of the reports, still only 10 reports in total, are in the Life cycle section.
These reports are where you will spend most of your time in GA4. We’ll look at these in more detail in our next lesson so let’s keep it to an overview for now.
Acquisition
Similar to the Acquisition section in UA but with just 3 reports.

The ‘Traffic Acquisition’ and ‘User Acquisition’ reports look like the same report but with slightly different metrics. They have a subtle but important difference.
‘User acquisition’ didn’t really have an equivalent in Universal Analytics, it measures the first channel users arrived at your site from.
Traffic acquisition is similar to the ‘Channels’ report in UA, it measures the last channel users visit your site from.
Engagement
The engagement section is similar to the Content section in UA. The reports tell you how people interact with your site.

Monetization
The Monetization section is equivalent to the Conversions section in UA.
The reports in this section vary depending on your business model with different reports for ecommerce, publishers, and games and apps developers.
They give a count of your revenue and show where it came from.

Retention
The retention report shows you how engagement and revenue change over time.

The User reports
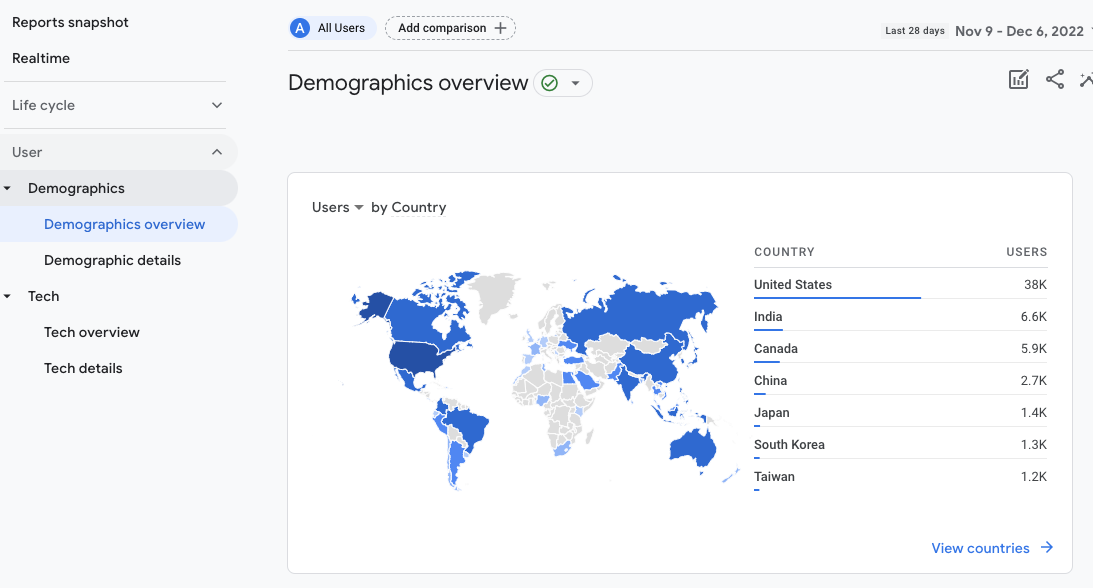
At the bottom of the Reports section, there’s the User section, which is a slimmed-down version of the Audience section in Universal Analytics.
The demographic reports cover things like countries, languages, ages, gender, and more. The tech reports cover devices, OSs, browsers, and more.
GA4 is here to stay
Hopefully, this article gives you a basic understanding of the benefits of GA4 and shows you how the reports are structured.
GA4 isn’t perfect but it does have some upsides. Once you start using it daily you’ll soon start getting more comfortable with it.
 All posts


